
Appearance
Exporting Data
Supersimple lets you export your data and visualizations for use in presentations, reports, or external tools. You can export a single block on its own, or a whole exploration at once.
Block exports
Individual blocks are exported from the three-dot menu in the block's corner.
As an image
You can export any block as a PNG image to use in presentations, documents, or share with colleagues.
- Open the three-dot menu on any block
- Select Export as image
- Choose how to save:
- Copy to clipboard — paste directly into documents, Slack, email, etc.
- Download — saves a PNG file to your computer
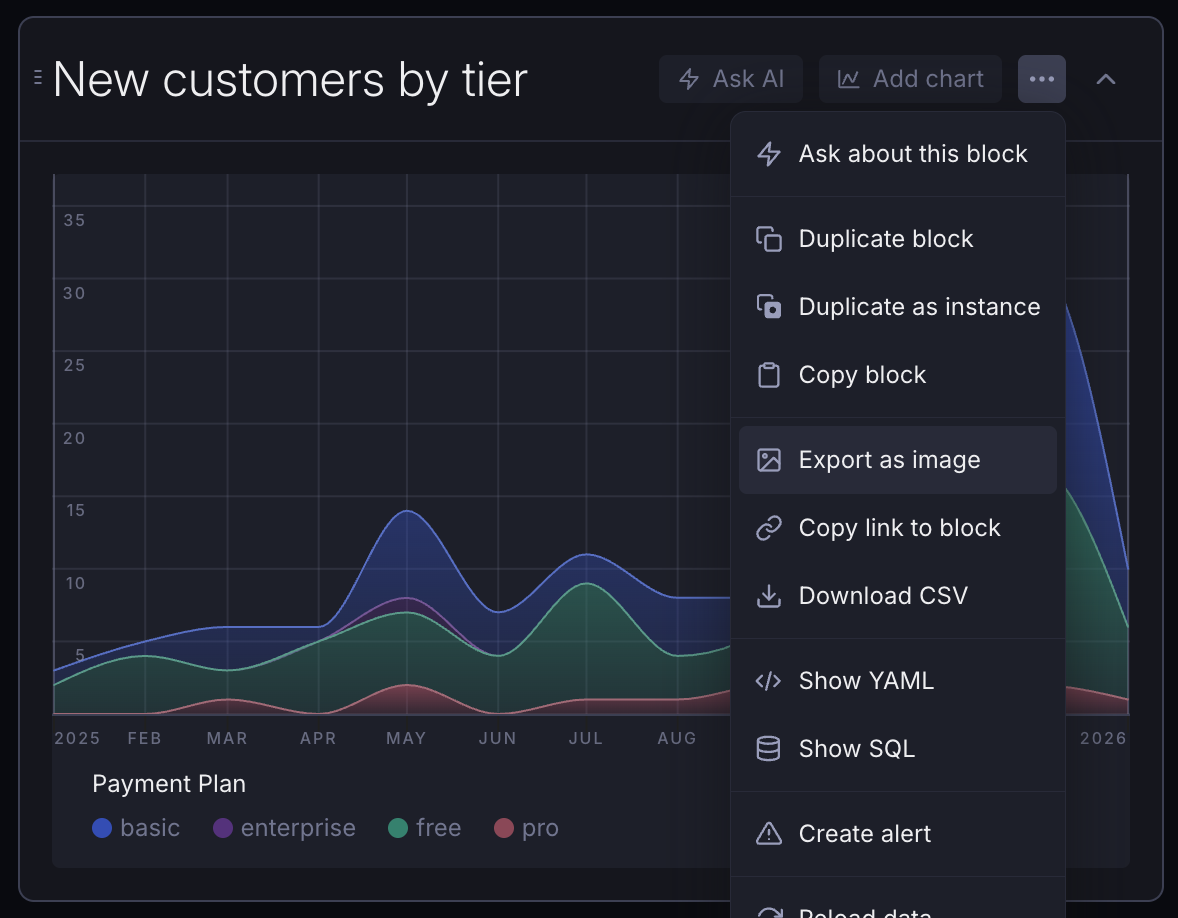
The exported image reflects the exact dimensions of the block, as currently visible in your browser.
As CSV
Data tables can be exported as CSV files for use in spreadsheets or other tools.
- Open the three-dot menu on any block
- Select Download CSV
The CSV file will download automatically with a timestamped filename. Note that the CSV's content will match the content of that block's table, not necessarily the currently-visible chart.
What's included
- All visible columns in the table (hidden columns are excluded)
- Column headers use the display names from your data model
Data formatting
- Arrays and nested objects are converted to JSON strings
- Empty values appear as blank cells
- The CSV uses standard comma-separated formatting compatible with Excel, Google Sheets, and other tools
Exploration exports
Instead of exporting one block at a time, you can export the entire exploration at once — either downloaded immediately, or delivered by email or Slack on a recurring schedule. Every expanded block is captured as a separate PNG image, so collapse anything you don't want included.
Both start from the export icon in the exploration's toolbar. Hover it to choose Download now or Create scheduled export.
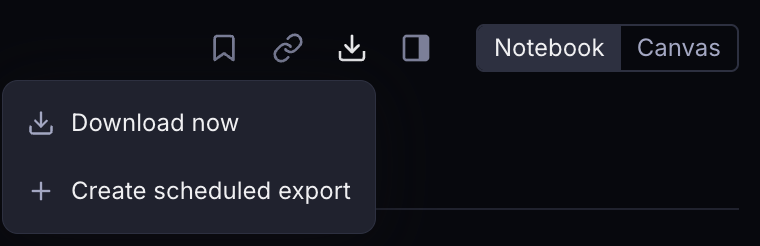
Any exploration can be exported, saved or not. The export captures exactly what you're looking at, the same way a shared link does.
Downloading a ZIP
- Hover the export icon and choose Download now
- Click Download ZIP
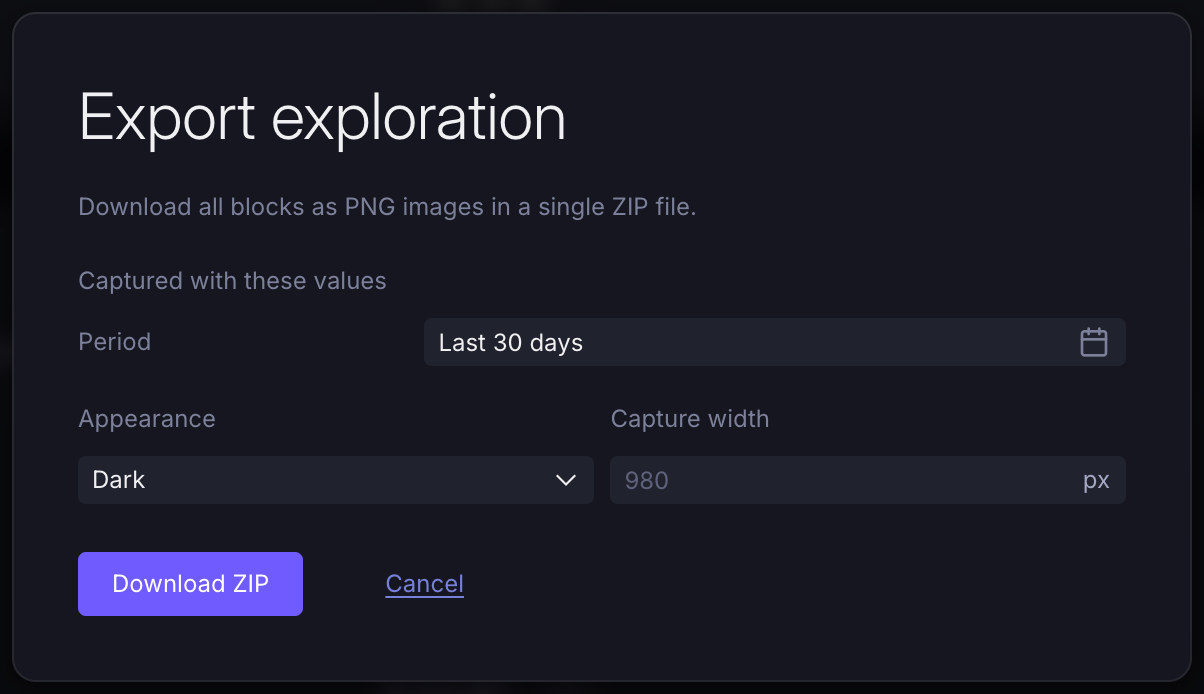
The ZIP contains one PNG per expanded block, numbered in the order they appear. Rendering happens on our servers and takes a few seconds to a minute depending on the size of the exploration, so the dialog stays open until the download starts.
Appearance switches the images between light and dark mode. Capture width controls how wide the exploration is laid out before it's captured, in pixels — blocks keep their relative layout, so blocks that sit side by side share that width.
If the exploration has variables, the dialog lists the values it will be captured with.
Scheduled exports
The same images can be delivered on a recurring basis: by email, embedded directly in the message so recipients see the charts without opening anything, or posted to a Slack channel.
- Hover the export icon and choose Create scheduled export
- Give it a name, and set the frequency, time and where it goes
- Click Save scheduled export
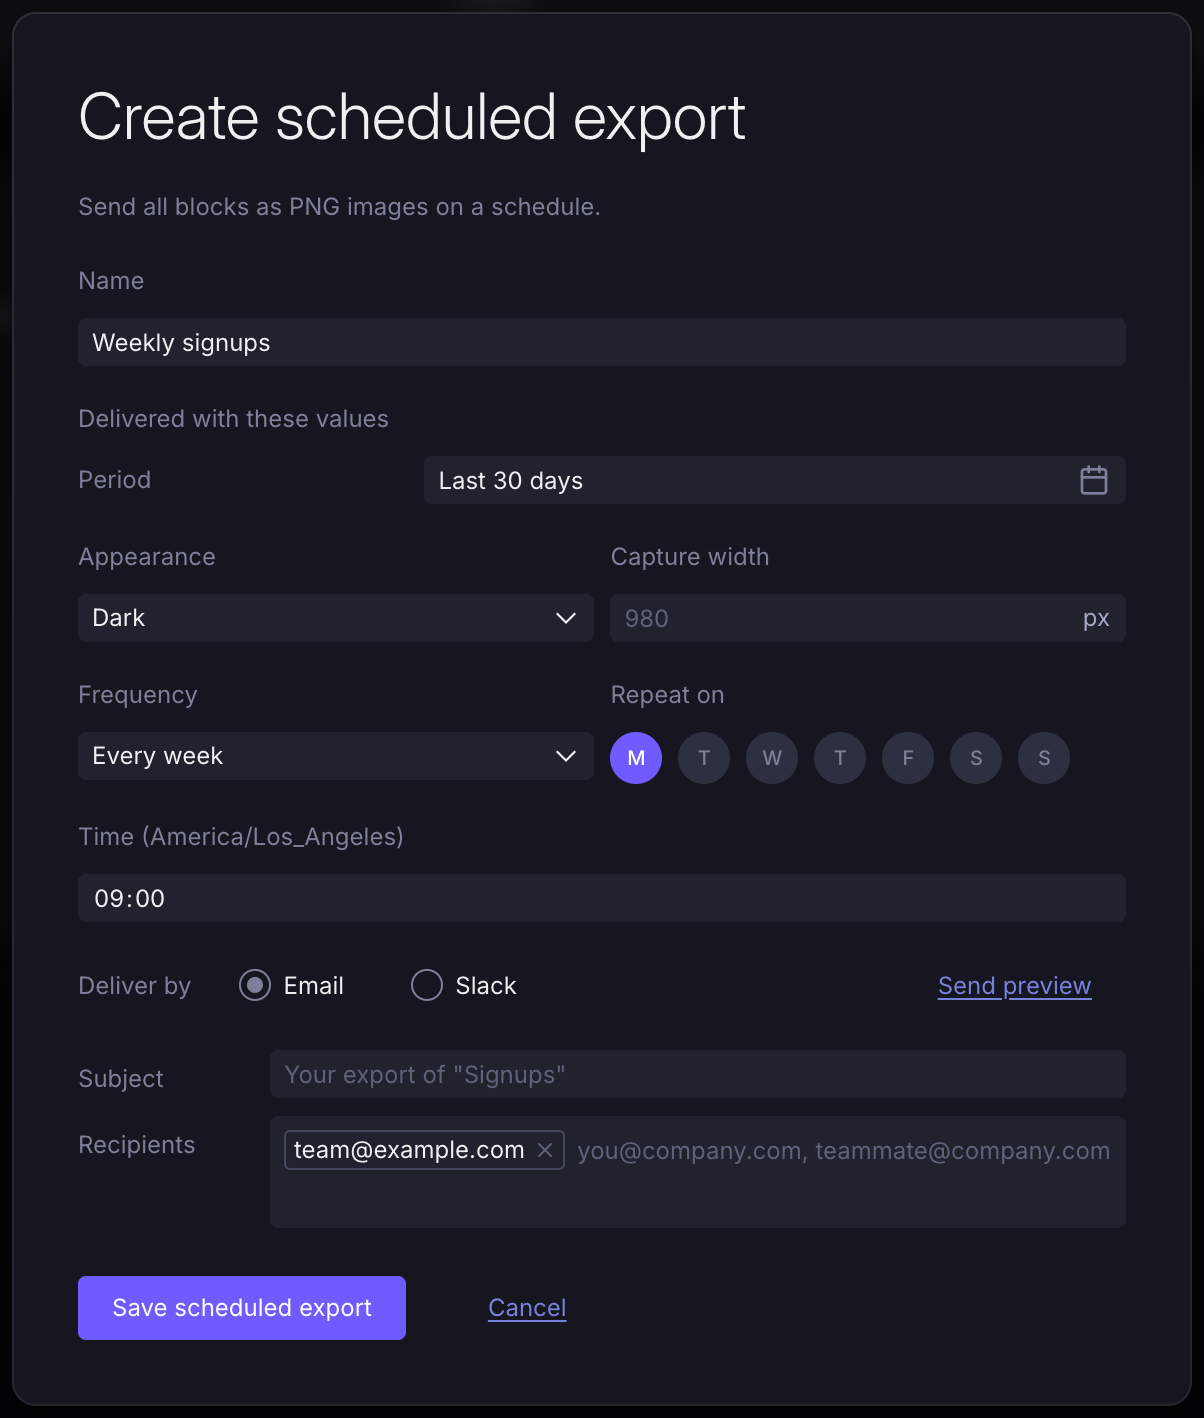
- Name — how the export is listed in the sidebar. Each name can be used once per account.
- Frequency — every day, every week (pick which weekdays) or every month (pick a day). Scheduled exports can run at most once an hour.
- Day of month — days 29–31 are missing from some months, so the latest day you can pick is 28.
- Time — in your account's timezone, shown next to the field.
- Deliver by — Email to up to 20 recipients, or Slack to a channel.
- Subject — the email's subject line, or the title above the images in Slack. Left empty, it's based on the exploration's name.
Send preview delivers a test export right away, to the recipients or channel you've set, before you save.
Slack delivery needs the Slack integration, which account admins can connect under the Integrations tab of account settings. Supersimple joins a public channel on its own the first time it posts there. For a private channel, invite the Supersimple app to it first.
What gets delivered
A scheduled export delivers the exploration exactly as it was when you saved it, including the open tab and any variable values. Editing the exploration afterwards doesn't change the export until you update it.
Relative date ranges keep moving with time: an export set to Last 30 days always sends the 30 days before that run.
Managing scheduled exports
Every scheduled export in your account is listed in the left sidebar under Scheduled exports. Opening one shows exactly what it delivers, and the right sidebar shows when and where it goes, along with the tab and variable values it's sent with.
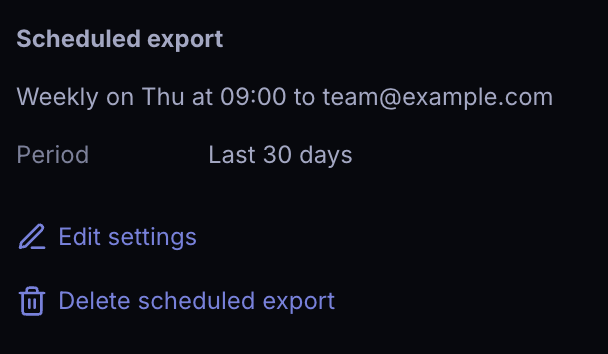
- Edit settings — change the name, schedule, delivery or appearance. The form starts from what's on your screen, so saving also updates what the export delivers.
- Delete scheduled export — stops the deliveries. The exploration itself isn't affected.
Editing what an export delivers
An export is anchored to the exploration as it looked when you saved it, so editing the exploration elsewhere leaves the deliveries untouched. To change them, open the export and edit from there.
- Open the export under Scheduled exports
- Change what you want delivered: switch tabs, set a variable, collapse a block
- Click Save changes to "…" in the right sidebar
As soon as you edit, the header reads Exploring from followed by the export's name. That's how you can tell you're looking at a version of the export rather than the export itself, and it stays while you keep exploring from it. Saving points the export at what's on your screen, from its next run onwards. Leaving without saving changes nothing.
Creating and editing scheduled exports requires the Manage Scheduled Exports permission, held by Admins and Editors by default. Anyone can download an export.