Appearance
Funnel Reports
Funnel reports are a powerful tool for understanding customer journeys. They help you identify where users are dropping off and where they are converting. This information can help you identify areas of improvement in your app.
Creating a Funnel Chart
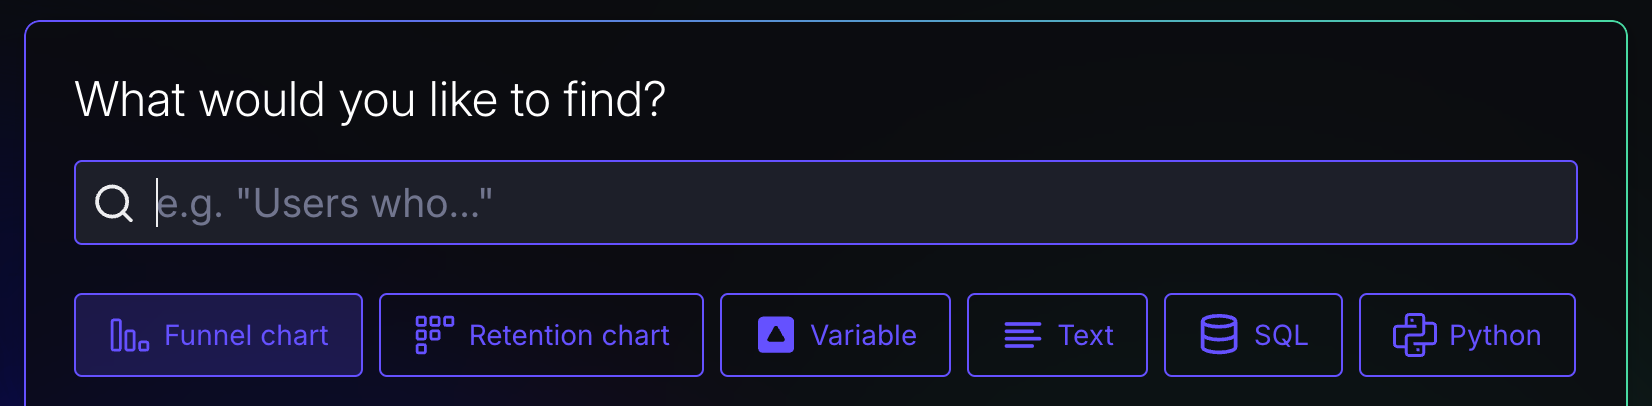
To create a funnel Supersimple, choose Funnel chart from the new block menu, or straight from the Explore page.
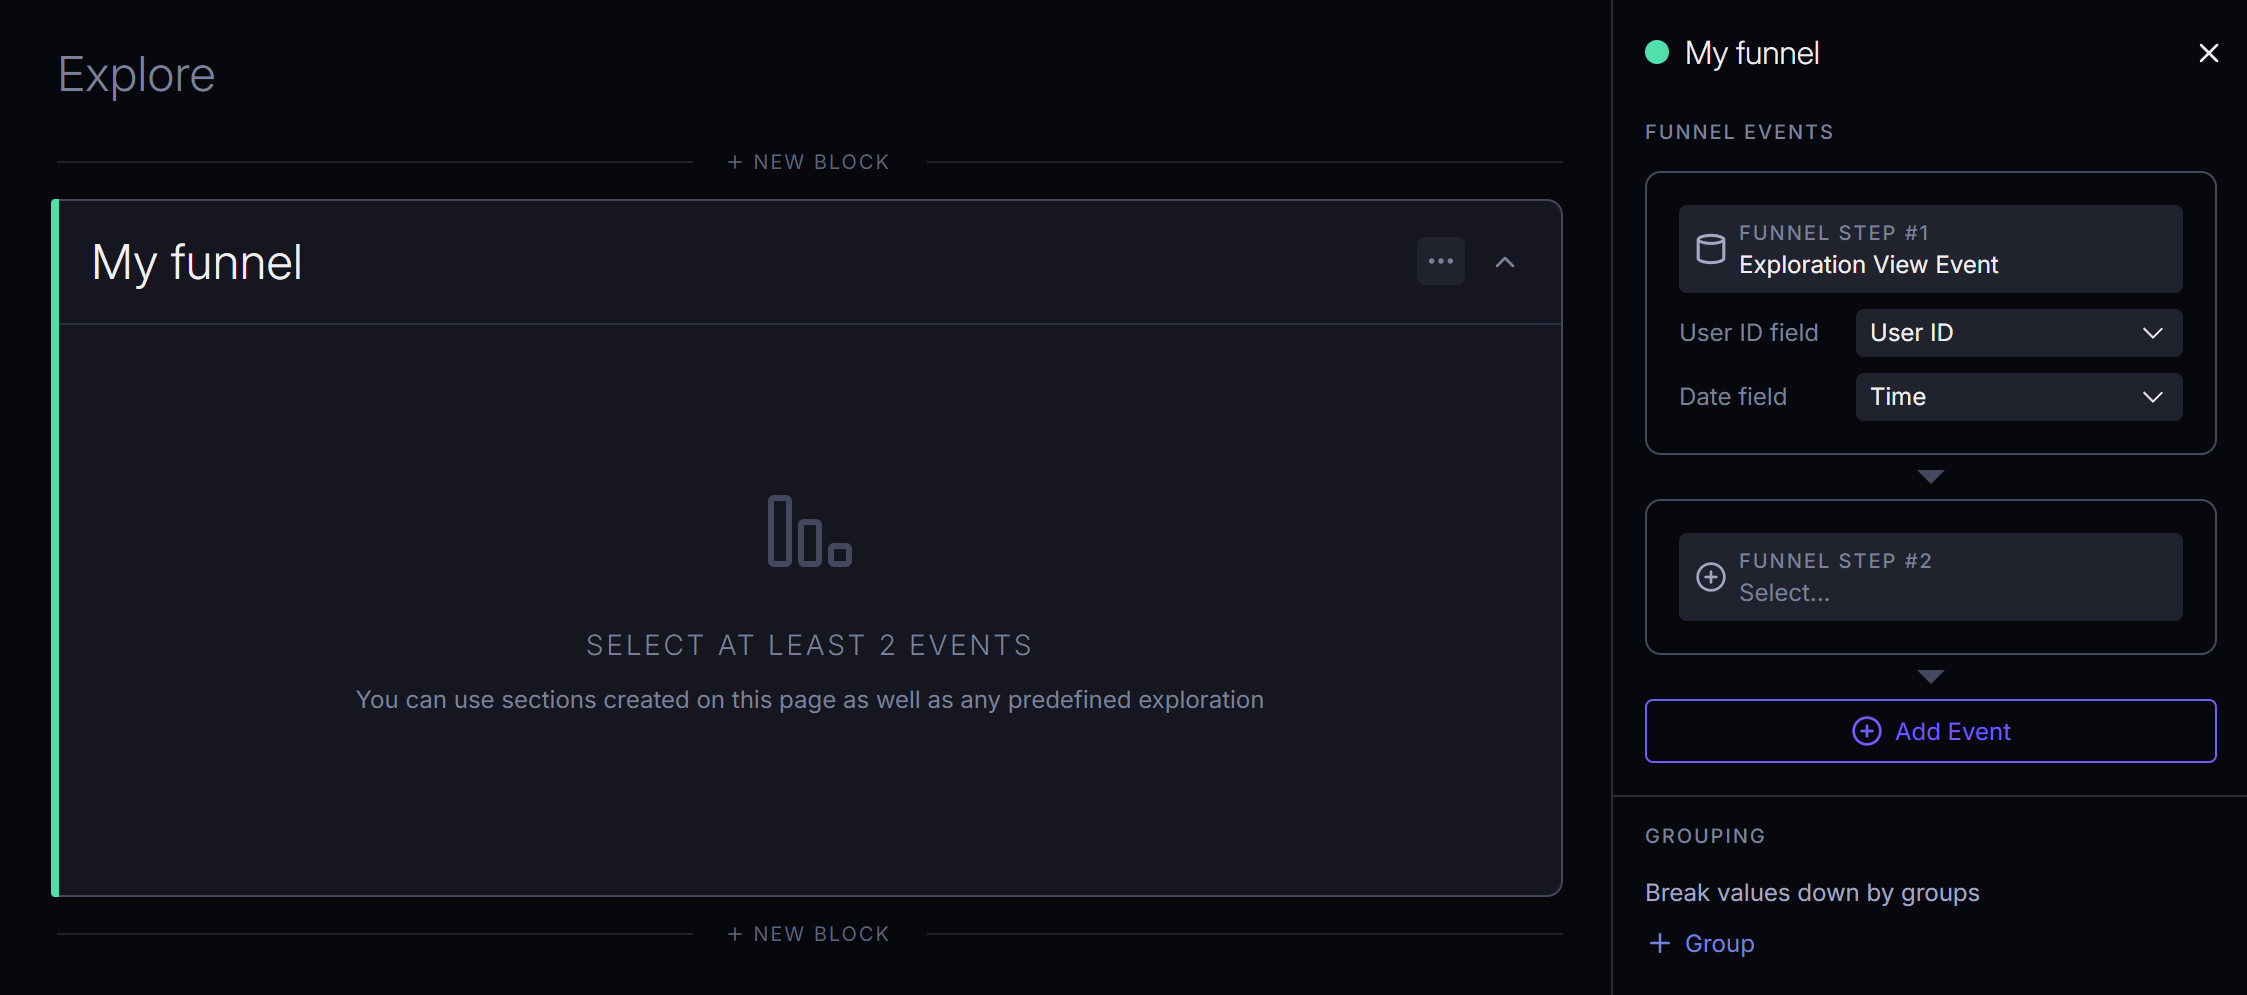
Each Funnel consists of 2 or more steps or events. With the Funnel block selected, you can choose those steps in the sidebar.
You can use any data model or block from the currently open exploration to create a funnel. Each input to the funnel block should have:
- An identifier for the user, or company, or similar entity that is going through the funnel
- A timestamp (funnel steps are ordered by time)
Breakdowns
To break down a funnel, add a grouping via the sidebar by selecting a field that all of your steps have in common. This could be a user property, a company property, or a custom event property.
TIP
It's often helpful to create helper blocks where you add extra properties to your events that you wish to use for grouping in your funnel. For example, adding Company Payment Plan to onboarding events.